%20%20-%20Menu.svg)







.webp?width=960&height=720&name=ezgif.com-webp-maker%20(9).webp)
In this blog
Introduction
Festive peak is coming. Order volumes will spike, carriers will come under strain, and delivery performance across the ecosystem will get harder to hold. Before that pressure hits, it's worth looking at what happened the last time the market slowed, because it tells us exactly how the Performance-Based Allocation (PBA) Engine behaves when conditions turn.
One of the most common questions we hear from enterprises after introducing PBA is simple, direct, and completely fair:
"Will PBA improve our logistics metrics every single time?"
At first glance, the expectation makes sense. When businesses invest in an optimization engine, they naturally look for better OFD TAT, lower RTO, stronger SLA adherence, fewer breaches, and smoother last-mile performance.
But here's the honest answer: PBA is not a magic wand that guarantees every metric will improve in every situation.
What PBA does guarantee is that it will continuously evaluate the options available, compare carrier and lane performance, and make allocation decisions that place each shipment in the best possible position under current market conditions.
That distinction matters most heading into peak. The true value of an optimization engine is not measured when everything is going well. It is measured when the market is under pressure, which is precisely what the festive season brings.
And that is exactly what the March to May 2026 summer slowdown already gave us: a real-world stress test of PBA, and a preview of how it will hold the line when festive volumes surge.
A constant eye on on-ground carrier performance
Unlike a static allocation rule, PBA does not simply assign a carrier once and forget about it. It keeps a constant eye on the on-ground performance of carriers, watching how they perform across lanes, how quickly they move shipments, how often they breach SLAs, and where return risks begin to rise.
As carrier performance shifts due to operational challenges, seasonal pressure, capacity constraints, or lane-specific disruptions, PBA reactively adjusts allocation decisions. Instead of continuing to send shipments to a carrier that is slipping, the engine looks for comparatively better-performing alternatives and redirects volume where it can create the most impact.
This is what makes PBA an optimization engine rather than just an automation tool: it is always looking for a better answer. During festive peak, when carrier performance can shift week to week, that continuous evaluation is what keeps shipments moving.
The summer slowdown: a preview of peak pressure
During the summer months from March to May 2026, many enterprises across the logistics ecosystem experienced a noticeable degradation in key performance metrics. OFD TAT increased, Last Mile TAT was impacted, SLA adherence became harder to maintain, and RTO trends showed stress in several lanes.
These were not isolated incidents. The pressure was broad, seasonal, and operationally real. It is the same kind of pressure festive peak creates, only compressed into a shorter, sharper window.
The question was no longer, "Can PBA improve metrics in a good market?"
The real question became: "Can PBA help enterprises stay in a better position when the entire market is deteriorating?"
To answer that, we analyzed allocation health-report data across multiple enterprises during the March to May 2026 period. What we found is the clearest indication of how enterprises on PBA will fare when the festive rush arrives.
The scale of optimization: shipment by shipment, every day
Optimization is not a one-time setup. It happens shipment by shipment, every single day.
Across the enterprises we studied, PBA did not sit still even as the market softened:
-
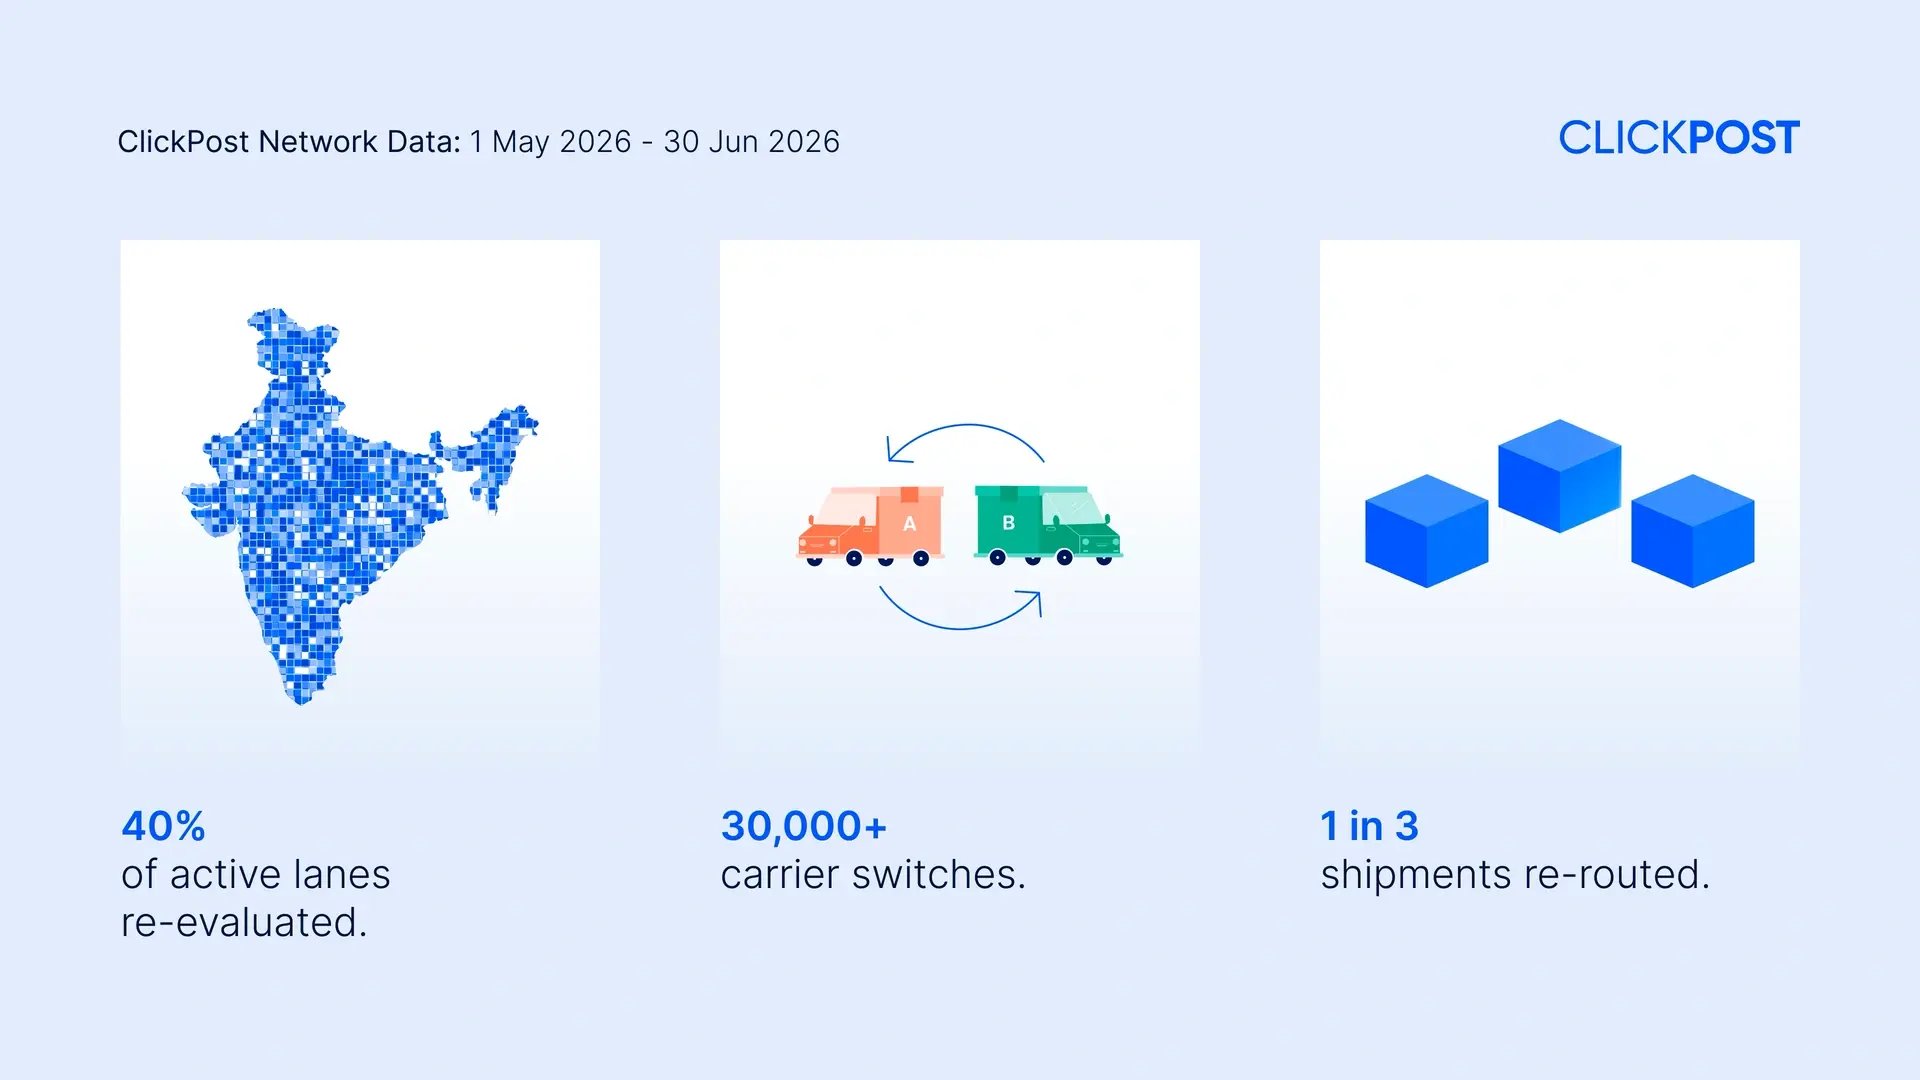
It re-evaluated and changed the recommended carrier on ~40 to 50% of active multi-shipment lanes during the two-month stress period.
-
This resulted in tens of thousands of carrier switches per enterprise, ranging from a few thousand on smaller books to ~30,000 switches on larger ones.
-
In practical terms, 30 to 45% of shipments were re-routed to a carrier different from the lane's previous default, meaning a significant share of volume was actively moved toward a better-performing option.
This proves an important point for the season ahead: PBA works constantly, not just once. It continuously monitors on-ground carrier performance and makes fresh allocation decisions whenever conditions change. That is exactly the behavior you want when festive volumes stress every lane at once.
The quality of each decision: P1 vs. the next-best option
Scale alone is not enough. The real question is whether each allocation decision was actually better than the alternative.
To measure this, we compared the carrier PBA chose (Preference 1) with the next-best available carrier it rejected (Preference 2) for the exact same shipments.
The findings were clear:
-
The carrier selected by PBA was ~20 to 27% faster than the next-best option on the same shipment.
-
PBA chose the lower-risk carrier in roughly two out of three orders.
-
Had the shipment gone to the rejected alternative instead of PBA's chosen carrier, the return-risk outcome would have been ~38% worse on the return-sensitive book.
In other words, PBA was not simply making a choice. It was consistently making the better of the available choices, decision after decision. At a festive scale, that edge compounds across every order.
What PBA actually saved during the summer slowdown
This is where the March to May 2026 period became more than just a seasonal slowdown. It became a real-world comparison between two scenarios that will repeat during festive peak:
-
What would have happened if the enterprise stayed with the degrading carrier?
-
What happened because PBA reacted and moved the lane to a better-performing carrier?
The numbers below tell that story clearly.
PBA by the numbers, Summer Stress Test (March to May 2026)
On the lanes where PBA changed the carrier, we compared the performance of the original carrier that PBA moved off with the new carrier that PBA moved to.
| Metric | The carrier PBA moved off | What PBA moved to | Impact |
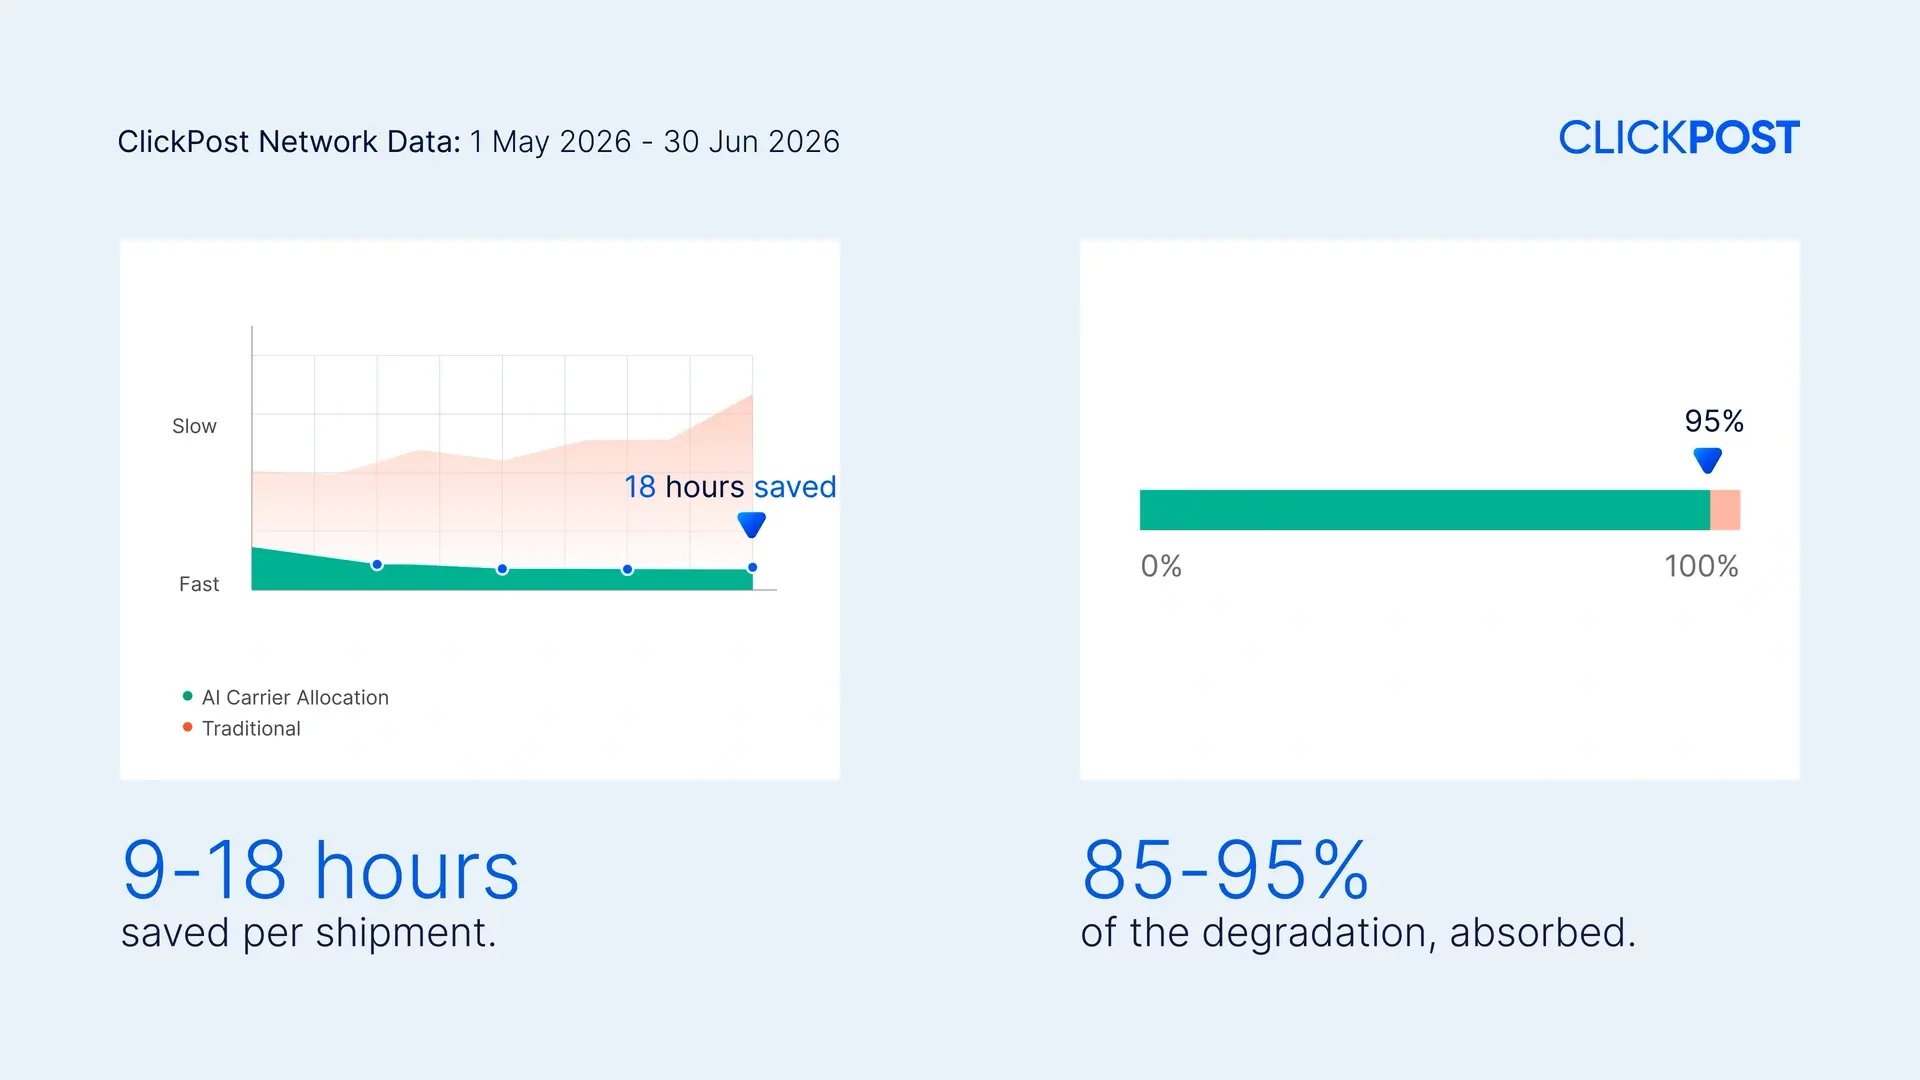
| Delivery speed (TAT) | Degraded by +10 to +14 hrs (+12 to 18%) | Held to only ~+1 hr above the original baseline, and sometimes even faster than the original carrier | ~9 to 18 hrs saved per shipment |
| Return risk (LMT) | Return-risk proxy increased by ~+67% | Brought back below the starting point | ~85 to 95% of degradation absorbed |
What makes this comparison powerful is that each row represents a direct before-and-after decision:
Column 1, "The carrier PBA moved off" shows how much the original carrier degraded. Its delivery speed slipped by +10 to +14 hours (12 to 18%), and its return-risk proxy jumped by ~67%. This is the damage an enterprise would suffer by doing nothing and staying with the same carrier, the exact risk that magnifies during festive peak.
Column 2, "What PBA moved to" shows the new carrier that PBA selected after reacting to the on-ground performance changes. Its delivery speed was held to only ~+1 hour above the original baseline, and in some cases it was even faster than the original carrier. Its return-risk profile was also brought below where it had originally started.
Column 3, "Impact" is the difference between those two scenarios. In simple terms, the switch saved 9 to 18 hours per shipment on delivery speed and absorbed 85 to 95% of the degradation on return risk.
So every row in this analysis can be read as a simple equation:
If PBA had not acted (Column 1) versus what PBA delivered after reacting (Column 2) equals the saving created by the allocation switch (Column 3).
That is the clearest proof that PBA was not merely observing the summer slowdown. It was actively steering enterprises away from the worst of it, and it is the same protection that will keep enterprises delivering through the festive rush.
What this period really proved
We should be precise here: much of the market-wide degradation during the summer was organic. Carriers themselves were getting worse under seasonal pressure, and no allocation engine can prevent that entirely. The same will be true at festive peak.
What PBA can do, and what it demonstrably did, is ensure that enterprises were better positioned than they would have been without it.
It kept watching on-ground carrier performance. It kept learning from changing conditions. And it kept making reactive allocation changes to move shipments away from slipping carriers and toward comparatively stronger options.
That is the difference between a static allocation system and a true optimization engine, and it is the difference that will show up again when festive volumes hit.
The takeaway heading into festive peak
The March to May 2026 summer slowdown was not just a season of operational pressure. It was a real-world validation of the PBA Engine, and a dry run for the festive rush ahead.
The numbers tell the story:
-
Tens of thousands of allocation decisions made daily across enterprises.
-
~40 to 50% of active lanes re-evaluated and optimized.
-
~20 to 27% faster decisions than the next-best alternative.
-
Lower RTO risk across a significant share of shipments.
-
9 to 18 hours saved per shipment on affected lanes.
-
~85 to 95% of degradation absorbed where carriers were slipping.
True optimization is not about promising perfection. It is about continuously chasing the best possible allocation decision, whether the market is improving, stable, or under strain.
The summer months proved that the PBA Engine does exactly that: it keeps watching, keeps learning, and keeps optimizing, every shipment, every lane, and every condition. Festive peak is the next real test of that behavior, and this analysis is the clearest evidence we have of how PBA will hold up when it arrives. Peak Proof.
Note: figures are aggregated and anonymized across multiple enterprises' allocation health-report data from March to May 2026. Exact impact varies based on an enterprise's carrier mix, lane profile, and payment-mode split.